Critical Value Calculator
Enter the significant level along with degrees of freedom and the tool will try to figure out critical values for T, Z, Chi, and F distributions.
Use this Critical Value Calculator to quickly find critical values for Z, T, Chi-Square, and F distributions at any significance level (alpha). It helps you clearly identify rejection regions in hypothesis testing and make accurate statistical decisions. Whether you're working on exams, research, or data analysis, this tool simplifies complex probability distributions into easy-to-understand results with step-by-step support.
The Critical Value Calculator makes statistical testing faster and more reliable by instantly computing left-tailed, right-tailed, and two-tailed critical values for different distributions. With the Critical Value Calculator, you can easily interpret hypothesis test boundaries without manually checking complex tables.
Using the Critical Value Calculator, students and researchers can save time, reduce errors, and improve accuracy in statistical analysis.
Get the critical values associated with a particular significance level (alpha) and statistical distributions with the critical value calculator.
The calculator functions to provide left-tailed, right-tailed, and two-tailed P values for Chi-square, T, F, R, and Z score values that help you better judge the critical points of the given probability density function.
What Is a Critical Value?
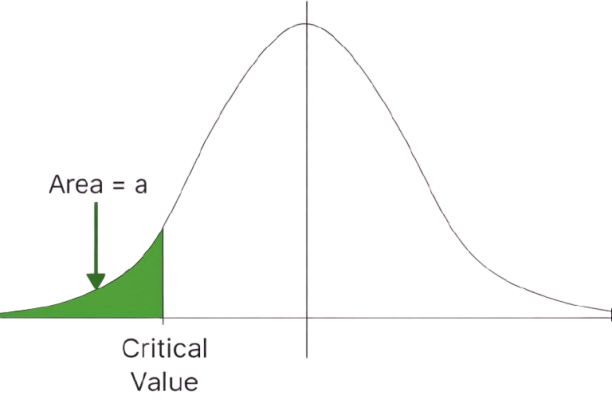
A critical value is said to be as a line on a graph that divides a distribution graph into sections that indicate ‘rejection regions.’ Generally, if a test value falls into a rejection rejoin, then it means that an accepted hypothesis (represent as a null hypothesis) should be rejected.
Left-tailed Test: \(Q(\alpha)\)
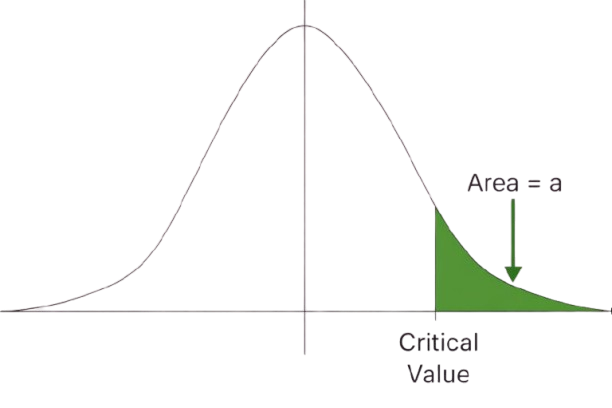
Right-tailed Test: \(Q(1 - \alpha)\)
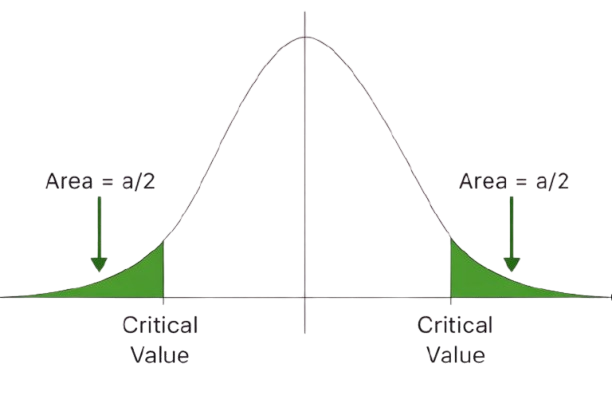
Two-tailed Test: \(Q\left(\frac{\alpha}{2}\right) \cup Q\left(1 - \frac{\alpha}{2}\right)\)
How to Calculate Critical Value With This Tool
Simply, you just have to follow the given steps:
Find Critical Value for T
Inputs:
- At first, you ought to select the option “Critical value for t” from the drop-down list
- Now, you just have to add the value of the “significance level” into the designated field
- Finally, you have to add the value of “degrees of freedom” into the designated field
Outputs: After adding values into the above fields, just hit the calculate button:
- Critical value for t (Right Tailed)
- Critical value for t (Two Tailed)
Find Critical Value For Z
Inputs:
- You just have to choose the option “Critical value for z” form the drop-down menu of this tool
- Right after, you ought to add the value of the “significance level” into the given box
Outputs: Now, hit the calculate button, this z value calculator will show:
- Critical value for z (Right Tailed)
- Critical value for z (Two Tailed)
Find Critical Value for Chi-Square
Inputs:
- First, choose the option “Critical value for chi-square” form the list of drop-down
- Then, simply add the value for a “significance level” into the above-designated box
- Very next, add the value for a “degrees of freedom” into the given field of calculator
Outputs: Now, you have to make a click on the calculate button to calculate chi square value for the distribution, the tool generates:
- Chi-Square critical value (Right Tailed)
- Chi-Square critical value (Two Tailed)
- P value (for the chi square distribution)
Find Critical Value For F
Inputs:
- First, choose the option of “Critical value for f” from the given drop-down menu
- Very next, you have to enter the value of a “degrees of freedom 1” into the designated field
- Right after, you ought to add the value of a “degrees if freedom 2” into the given box
- Finally, put the value of “significance level” into the designated box
Outputs: Once done, click on the calculate button, this f value calculator will generate:
- Critical value f (Right Tailed)
- Critical value f (Two Tailed)
Z Score Table (Right):
The z-table is the normal distribution shows the area to the right-hand side of the curve. You can use these values to determine the area between z=0 and any positive (+) value.
Div:
| z | 0.00 | 0.01 | 0.02 | 0.03 | 0.04 | 0.05 | 0.06 | 0.07 | 0.08 | 0.09 |
|---|---|---|---|---|---|---|---|---|---|---|
| 0.0 | 0.0000 | 0.0040 | 0.0080 | 0.0120 | 0.0160 | 0.0199 | 0.0239 | 0.0279 | 0.0319 | 0.0359 |
| 0.1 | 0.0398 | 0.0438 | 0.0478 | 0.0517 | 0.0557 | 0.0596 | 0.0636 | 0.0675 | 0.0714 | 0.0753 |
| 0.2 | 0.0793 | 0.0832 | 0.0871 | 0.0910 | 0.0948 | 0.0987 | 0.1026 | 0.1064 | 0.1103 | 0.1141 |
| 0.3 | 0.1179 | 0.1217 | 0.1255 | 0.1293 | 0.1331 | 0.1368 | 0.1406 | 0.1443 | 0.1480 | 0.1517 |
| 0.4 | 0.1554 | 0.1591 | 0.1628 | 0.1664 | 0.1700 | 0.1736 | 0.1772 | 0.1808 | 0.1844 | 0.1879 |
| 0.5 | 0.1915 | 0.1950 | 0.1985 | 0.2019 | 0.2054 | 0.2088 | 0.2123 | 0.2157 | 0.2190 | 0.2224 |
| 0.6 | 0.2257 | 0.2291 | 0.2324 | 0.2357 | 0.2389 | 0.2422 | 0.2454 | 0.2486 | 0.2517 | 0.2549 |
| 0.7 | 0.2580 | 0.2611 | 0.2642 | 0.2673 | 0.2704 | 0.2734 | 0.2764 | 0.2794 | 0.2823 | 0.2852 |
| 0.8 | 0.2881 | 0.2910 | 0.2939 | 0.2967 | 0.2995 | 0.3023 | 0.3051 | 0.3078 | 0.3106 | 0.3133 |
| 0.9 | 0.3159 | 0.3186 | 0.3212 | 0.3238 | 0.3264 | 0.3289 | 0.3315 | 0.3340 | 0.3365 | 0.3389 |
| 1.0 | 0.3413 | 0.3438 | 0.3461 | 0.3485 | 0.3508 | 0.3531 | 0.3554 | 0.3577 | 0.3599 | 0.3621 |
| 1.1 | 0.3643 | 0.3665 | 0.3686 | 0.3708 | 0.3729 | 0.3749 | 0.3770 | 0.3790 | 0.3810 | 0.3830 |
| 1.2 | 0.3849 | 0.3869 | 0.3888 | 0.3907 | 0.3925 | 0.3944 | 0.3962 | 0.3980 | 0.3997 | 0.4015 |
| 1.3 | 0.4032 | 0.4049 | 0.4066 | 0.4082 | 0.4099 | 0.4115 | 0.4131 | 0.4147 | 0.4162 | 0.4177 |
| 1.4 | 0.4192 | 0.4207 | 0.4222 | 0.4236 | 0.4251 | 0.4265 | 0.4279 | 0.4292 | 0.4306 | 0.4319 |
| 1.5 | 0.4332 | 0.4345 | 0.4357 | 0.4370 | 0.4382 | 0.4394 | 0.4406 | 0.4418 | 0.4429 | 0.4441 |
| 1.6 | 0.4452 | 0.4463 | 0.4474 | 0.4484 | 0.4495 | 0.4505 | 0.4515 | 0.4525 | 0.4535 | 0.4545 |
| 1.7 | 0.4554 | 0.4564 | 0.4573 | 0.4582 | 0.4591 | 0.4599 | 0.4608 | 0.4616 | 0.4625 | 0.4633 |
| 1.8 | 0.4641 | 0.4649 | 0.4656 | 0.4664 | 0.4671 | 0.4678 | 0.4686 | 0.4693 | 0.4699 | 0.4706 |
| 1.9 | 0.4713 | 0.4719 | 0.4726 | 0.4732 | 0.4738 | 0.4744 | 0.4750 | 0.4756 | 0.4761 | 0.4767 |
| 2.0 | 0.4772 | 0.4778 | 0.4783 | 0.4788 | 0.4793 | 0.4798 | 0.4803 | 0.4808 | 0.4812 | 0.4817 |
| 2.1 | 0.4821 | 0.4826 | 0.4830 | 0.4834 | 0.4838 | 0.4842 | 0.4846 | 0.4850 | 0.4854 | 0.4857 |
| 2.2 | 0.4861 | 0.4864 | 0.4868 | 0.4871 | 0.4875 | 0.4878 | 0.4881 | 0.4884 | 0.4887 | 0.4890 |
| 2.3 | 0.4893 | 0.4896 | 0.4898 | 0.4901 | 0.4904 | 0.4906 | 0.4909 | 0.4911 | 0.4913 | 0.4916 |
| 2.4 | 0.4918 | 0.4920 | 0.4922 | 0.4925 | 0.4927 | 0.4929 | 0.4931 | 0.4932 | 0.4934 | 0.4936 |
| 2.5 | 0.4938 | 0.4940 | 0.4941 | 0.4943 | 0.4945 | 0.4946 | 0.4948 | 0.4949 | 0.4951 | 0.4952 |
| 2.6 | 0.4953 | 0.4955 | 0.4956 | 0.4957 | 0.4959 | 0.4960 | 0.4961 | 0.4962 | 0.4963 | 0.4964 |
| 2.7 | 0.4965 | 0.4966 | 0.4967 | 0.4968 | 0.4969 | 0.4970 | 0.4971 | 0.4972 | 0.4973 | 0.4974 |
| 2.8 | 0.4974 | 0.4975 | 0.4976 | 0.4977 | 0.4977 | 0.4978 | 0.4979 | 0.4979 | 0.4980 | 0.4981 |
| 2.9 | 0.4981 | 0.4982 | 0.4982 | 0.4983 | 0.4984 | 0.4984 | 0.4985 | 0.4985 | 0.4986 | 0.4986 |
| 3.0 | 0.4987 | 0.4987 | 0.4987 | 0.4988 | 0.4988 | 0.4989 | 0.4989 | 0.4989 | 0.4990 | 0.4990 |
| 3.1 | 0.4990 | 0.4991 | 0.4991 | 0.4991 | 0.4992 | 0.4992 | 0.4992 | 0.4992 | 0.4993 | 0.4993 |
| 3.2 | 0.4993 | 0.4993 | 0.4994 | 0.4994 | 0.4994 | 0.4994 | 0.4994 | 0.4995 | 0.4995 | 0.4995 |
| 3.3 | 0.4995 | 0.4995 | 0.4995 | 0.4996 | 0.4996 | 0.4996 | 0.4996 | 0.4996 | 0.4996 | 0.4997 |
| 3.4 | 0.4997 | 0.4997 | 0.4997 | 0.4997 | 0.4997 | 0.4997 | 0.4997 | 0.4997 | 0.4997 | 0.4998 |
| 3.5 | 0.4998 | 0.4998 | 0.4998 | 0.4998 | 0.4998 | 0.4998 | 0.4998 | 0.4998 | 0.4998 | 0.4998 |
| 3.6 | 0.4998 | 0.4998 | 0.4999 | 0.4999 | 0.4999 | 0.4999 | 0.4999 | 0.4999 | 0.4999 | 0.4999 |
| 3.7 | 0.4999 | 0.4999 | 0.4999 | 0.4999 | 0.4999 | 0.4999 | 0.4999 | 0.4999 | 0.4999 | 0.4999 |
| 3.8 | 0.4999 | 0.4999 | 0.4999 | 0.4999 | 0.4999 | 0.4999 | 0.4999 | 0.4999 | 0.4999 | 0.4999 |
Z Score Table (Left):
The left z-table shows the area to the left of Z.
Div:
| Z | 0.00 | 0.01 | 0.02 | 0.03 | 0.04 | 0.05 | 0.06 | 0.07 | 0.08 | 0.09 |
|---|---|---|---|---|---|---|---|---|---|---|
| 0.0 | 0.5000 | 0.5040 | 0.5080 | 0.0120 | 0.0160 | 0.0199 | 0.5239 | 0.0279 | 0.0319 | 0.0359 |
| 0.1 | 0.5398 | 0.5438 | 0.5478 | 0.5517 | 0.5557 | 0.5596 | 0.5636 | 0.5675 | 0.5714 | 0.5753 |
| 0.2 | 0.5793 | 0.5832 | 0.5871 | 0.5910 | 0.5948 | 0.5987 | 0.6064 | 0.1064 | 0.6103 | 0.6141 |
| 0.3 | 0.6179 | 0.6217 | 0.6255 | 0.6293 | 0.6331 | 0.6368 | 0.6406 | 0.6443 | 0.6480 | 0.6517 |
| 0.4 | 0.6554 | 0.6591 | 0.6628 | 0.6664 | 0.6700 | 0.6736 | 0.6772 | 0.6808 | 0.6844 | 0.6879 |
| 0.5 | 0.6915 | 0.6950 | 0.6985 | 0.7019 | 0.7054 | 0.7088 | 0.7123 | 0.7157 | 0.7190 | 0.7224 |
| 0.6 | 0.7257 | 0.7291 | 0.7324 | 0.7357 | 0.7389 | 0.7422 | 0.7454 | 0.7486 | 0.7517 | 0.7549 |
| 0.7 | 0.7580 | 0.7611 | 0.7642 | 0.7673 | 0.7704 | 0.7734 | 0.7764 | 0.7794 | 0.7823 | 0.7852 |
| 0.8 | 0.7881 | 0.7910 | 0.7939 | 0.7967 | 0.7995 | 0.8023 | 0.8051 | 0.8078 | 0.8106 | 0.8133 |
| 0.9 | 0.8159 | 0.8186 | 0.8212 | 0.8238 | 0.8264 | 0.8289 | 0.8315 | 0.8340 | 0.8365 | 0.8389 |
| 1.0 | 0.8413 | 0.8438 | 0.8461 | 0.8485 | 0.8508 | 0.8531 | 0.8554 | 0.8577 | 0.8599 | 0.8621 |
| 1.1 | 0.8643 | 0.8665 | 0.8686 | 0.8708 | 0.8729 | 0.8749 | 0.8770 | 0.8790 | 0.8810 | 0.8830 |
| 1.2 | 0.8849 | 0.8869 | 0.8888 | 0.8907 | 0.8925 | 0.8944 | 0.8962 | 0.8980 | 0.8997 | 0.9015 |
| 1.3 | 0.9032 | 0.9049 | 0.9066 | 0.9082 | 0.9099 | 0.9115 | 0.9131 | 0.9147 | 0.9162 | 0.9177 |
| 1.4 | 0.9192 | 0.9207 | 0.9222 | 0.9236 | 0.9251 | 0.9265 | 0.9279 | 0.9292 | 0.9306 | 0.9319 |
| 1.5 | 0.9332 | 0.9345 | 0.9357 | 0.9370 | 0.9382 | 0.9394 | 0.9406 | 0.9418 | 0.9429 | 0.9441 |
| 1.6 | 0.9452 | 0.9463 | 0.9474 | 0.9484 | 0.9495 | 0.9505 | 0.9515 | 0.9525 | 0.9535 | 0.9545 |
| 1.7 | 0.9554 | 0.9564 | 0.9573 | 0.9582 | 0.9591 | 0.9599 | 0.9608 | 0.9616 | 0.9625 | 0.9633 |
| 1.8 | 0.9641 | 0.9649 | 0.9656 | 0.9664 | 0.9671 | 0.9678 | 0.9686 | 0.9693 | 0.9699 | 0.9706 |
| 1.9 | 0.9713 | 0.9719 | 0.9726 | 0.9732 | 0.9738 | 0.9744 | 0.9750 | 0.9756 | 0.9761 | 0.9767 |
| 2.0 | 0.9772 | 0.9778 | 0.9783 | 0.9788 | 0.9793 | 0.9798 | 0.9803 | 0.9808 | 0.9812 | 0.9817 |
| 2.1 | 0.9821 | 0.9826 | 0.9830 | 0.9834 | 0.9838 | 0.9842 | 0.9846 | 0.9850 | 0.9854 | 0.9857 |
| 2.2 | 0.9861 | 0.9864 | 0.9868 | 0.9871 | 0.9875 | 0.9878 | 0.9881 | 0.9884 | 0.9887 | 0.9890 |
| 2.3 | 0.9893 | 0.9896 | 0.9898 | 0.9901 | 0.9904 | 0.9906 | 0.9909 | 0.9911 | 0.9913 | 0.9916 |
| 2.4 | 0.9918 | 0.9920 | 0.9922 | 0.9925 | 0.9927 | 0.9929 | 0.9931 | 0.9932 | 0.9934 | 0.9936 |
| 2.5 | 0.9938 | 0.9940 | 0.9941 | 0.9943 | 0.9945 | 0.9946 | 0.9948 | 0.9949 | 0.9951 | 0.9952 |
| 2.6 | 0.9953 | 0.9955 | 0.9956 | 0.9957 | 0.9959 | 0.9960 | 0.9961 | 0.9962 | 0.9963 | 0.9964 |
| 2.7 | 0.9965 | 0.9966 | 0.9967 | 0.9968 | 0.9969 | 0.9970 | 0.9971 | 0.9972 | 0.9973 | 0.9974 |
| 2.8 | 0.9974 | 0.9975 | 0.9976 | 0.9977 | 0.9977 | 0.9978 | 0.9979 | 0.9979 | 0.9980 | 0.9981 |
| 2.9 | 0.9981 | 0.9982 | 0.9982 | 0.9983 | 0.9984 | 0.9984 | 0.9985 | 0.9985 | 0.9986 | 0.9986 |
| 3.0 | 0.9987 | 0.9987 | 0.9987 | 0.9988 | 0.9988 | 0.9989 | 0.9989 | 0.9989 | 0.9990 | 0.9990 |
T Critical Value Table (One Tail):
| df | a = 0.1 | 0.05 | 0.025 | 0.01 | 0.005 | 0.001 | 0.0005 |
|---|---|---|---|---|---|---|---|
| ∞ | ta = 1.282 | 1.645 | 1.960 | 2.326 | 2.576 | 3.091 | 3.291 |
| 1 | 3.078 | 6.314 | 12.706 | 31.821 | 63.656 | 318.289 | 636.578 |
| 2 | 1.886 | 2.920 | 4.303 | 6.965 | 9.925 | 22.328 | 31.600 |
| 3 | 1.638 | 2.353 | 3.182 | 4.541 | 5.841 | 10.214 | 12.924 |
| 4 | 1.533 | 2.132 | 2.776 | 3.747 | 4.604 | 7.173 | 8.610 |
| 5 | 1.476 | 2.015 | 2.571 | 3.365 | 4.032 | 5.894 | 6.869 |
| 6 | 1.440 | 1.943 | 2.447 | 3.143 | 3.707 | 5.208 | 5.959 |
| 7 | 1.415 | 1.895 | 2.365 | 2.998 | 3.499 | 4.785 | 5.408 |
| 8 | 1.397 | 1.860 | 2.306 | 2.896 | 3.355 | 4.501 | 5.041 |
| 9 | 1.383 | 1.833 | 2.262 | 2.821 | 3.250 | 4.297 | 4.781 |
| 10 | 1.372 | 1.812 | 2.228 | 2.764 | 3.169 | 4.144 | 4.587 |
| 11 | 1.363 | 1.796 | 2.201 | 2.718 | 3.106 | 4.025 | 4.437 |
| 12 | 1.356 | 1.782 | 2.179 | 2.681 | 3.055 | 3.930 | 4.318 |
| 13 | 1.350 | 1.771 | 2.160 | 2.650 | 3.012 | 3.852 | 4.221 |
| 14 | 1.345 | 1.761 | 2.145 | 2.624 | 2.977 | 3.787 | 4.140 |
| 15 | 1.341 | 1.753 | 2.131 | 2.602 | 2.947 | 3.733 | 4.073 |
| 16 | 1.337 | 1.746 | 2.120 | 2.583 | 2.921 | 3.686 | 4.015 |
| 17 | 1.333 | 1.740 | 2.110 | 2.567 | 2.898 | 3.646 | 3.965 |
| 18 | 1.330 | 1.734 | 2.101 | 2.552 | 2.878 | 3.610 | 3.922 |
| 19 | 1.328 | 1.729 | 2.093 | 2.539 | 2.861 | 3.579 | 3.883 |
| 20 | 1.325 | 1.725 | 2.086 | 2.528 | 2.845 | 3.552 | 3.850 |
| 21 | 1.323 | 1.721 | 2.080 | 2.518 | 2.831 | 3.527 | 3.819 |
| 22 | 1.321 | 1.717 | 2.074 | 2.508 | 2.819 | 3.505 | 3.792 |
| 23 | 1.319 | 1.714 | 2.069 | 2.500 | 2.807 | 3.485 | 3.768 |
| 24 | 1.318 | 1.711 | 2.064 | 2.492 | 2.797 | 3.467 | 3.745 |
| 25 | 1.316 | 1.708 | 2.060 | 2.485 | 2.787 | 3.450 | 3.725 |
| 26 | 1.315 | 1.706 | 2.056 | 2.479 | 2.779 | 3.435 | 3.707 |
| 27 | 1.314 | 1.703 | 2.052 | 2.473 | 2.771 | 3.421 | 3.689 |
| 28 | 1.313 | 1.701 | 2.048 | 2.467 | 2.763 | 3.408 | 3.674 |
| 29 | 1.311 | 1.699 | 2.045 | 2.462 | 2.756 | 3.396 | 3.660 |
| 30 | 1.310 | 1.697 | 2.042 | 2.457 | 2.750 | 3.385 | 3.646 |
| 60 | 1.296 | 1.671 | 2.000 | 2.390 | 2.660 | 3.232 | 3.460 |
| 120 | 1.289 | 1.658 | 1.980 | 2.358 | 2.617 | 3.160 | 3.373 |
| 1000 | 1.282 | 1.646 | 1.962 | 2.330 | 2.581 | 3.098 | 3.300 |
T Critical Value Table (Two Tails)
| df | a = 0.2 | 0.10 | 0.05 | 0.02 | 0.01 | 0.002 | 0.001 |
|---|---|---|---|---|---|---|---|
| ∞ | ta = 1.282 | 1.645 | 1.960 | 2.326 | 2.576 | 3.091 | 3.291 |
| 1 | 3.078 | 6.314 | 12.706 | 31.821 | 63.656 | 318.289 | 636.578 |
| 2 | 1.886 | 2.920 | 4.303 | 6.965 | 9.925 | 22.328 | 31.600 |
| 3 | 1.638 | 2.353 | 3.182 | 4.541 | 5.841 | 10.214 | 12.924 |
| 4 | 1.533 | 2.132 | 2.776 | 3.747 | 4.604 | 7.173 | 8.610 |
| 5 | 1.476 | 2.015 | 2.571 | 3.365 | 4.032 | 5.894 | 6.869 |
| 6 | 1.440 | 1.943 | 2.447 | 3.143 | 3.707 | 5.208 | 5.959 |
| 7 | 1.415 | 1.895 | 2.365 | 2.998 | 3.499 | 4.785 | 5.408 |
| 8 | 1.397 | 1.860 | 2.306 | 2.896 | 3.355 | 4.501 | 5.041 |
| 9 | 1.383 | 1.833 | 2.262 | 2.821 | 3.250 | 4.297 | 4.781 |
| 10 | 1.372 | 1.812 | 2.228 | 2.764 | 3.169 | 4.144 | 4.587 |
| 11 | 1.363 | 1.796 | 2.201 | 2.718 | 3.106 | 4.025 | 4.437 |
| 12 | 1.356 | 1.782 | 2.179 | 2.681 | 3.055 | 3.930 | 4.318 |
| 13 | 1.350 | 1.771 | 2.160 | 2.650 | 3.012 | 3.852 | 4.221 |
| 14 | 1.345 | 1.761 | 2.145 | 2.624 | 2.977 | 3.787 | 4.140 |
| 15 | 1.341 | 1.753 | 2.131 | 2.602 | 2.947 | 3.733 | 4.073 |
| 16 | 1.337 | 1.746 | 2.120 | 2.583 | 2.921 | 3.686 | 4.015 |
| 17 | 1.333 | 1.740 | 2.110 | 2.567 | 2.898 | 3.646 | 3.965 |
| 18 | 1.330 | 1.734 | 2.101 | 2.552 | 2.878 | 3.610 | 3.922 |
| 19 | 1.328 | 1.729 | 2.093 | 2.539 | 2.861 | 3.579 | 3.883 |
| 20 | 1.325 | 1.725 | 2.086 | 2.528 | 2.845 | 3.552 | 3.850 |
| 21 | 1.323 | 1.721 | 2.080 | 2.518 | 2.831 | 3.527 | 3.819 |
| 22 | 1.321 | 1.717 | 2.074 | 2.508 | 2.819 | 3.505 | 3.792 |
| 23 | 1.319 | 1.714 | 2.069 | 2.500 | 2.807 | 3.485 | 3.768 |
| 24 | 1.318 | 1.711 | 2.064 | 2.492 | 2.797 | 3.467 | 3.745 |
| 25 | 1.316 | 1.708 | 2.060 | 2.485 | 2.787 | 3.450 | 3.725 |
| 26 | 1.315 | 1.706 | 2.056 | 2.479 | 2.779 | 3.435 | 3.707 |
| 27 | 1.314 | 1.703 | 2.052 | 2.473 | 2.771 | 3.421 | 3.689 |
| 28 | 1.313 | 1.701 | 2.048 | 2.467 | 2.763 | 3.408 | 3.674 |
| 29 | 1.311 | 1.699 | 2.045 | 2.462 | 2.756 | 3.396 | 3.660 |
| 30 | 1.310 | 1.697 | 2.042 | 2.457 | 2.750 | 3.385 | 3.646 |
| 60 | 1.296 | 1.671 | 2.000 | 2.390 | 2.660 | 3.232 | 3.460 |
| 120 | 1.289 | 1.658 | 1.980 | 2.358 | 2.617 | 3.160 | 3.373 |
| 8 | 1.282 | 1.645 | 1.960 | 2.326 | 2.576 | 3.091 | 3.291 |
References:
From Wikipedia, the free encyclopedia – statistical test (z test) – calculate the standard score – examples – standard deviation of the scores – Next, calculate the z-score
Related Tools